
Account-level Dashboards
The Sentinel tab on the Accounts page includes dashboards for an account. The page has the following dashboards:
To view the dashboards, click an account name on the Accounts page, or on the Product Engagement dashboard. The Sentinel tab opens on the Accounts page.

Entitlement Summary
This dashboard provides an overview of the entitlement data for the account.

The following entitlement data points are available:
| Field | Description |
|---|---|
| Account Name | The Salesforce account name of the customer. |
| Product Name |
The product name in Sentinel EMS purchased by the customer. |
| Purchased | The total purchased quantity of the product that has not expired. |
| Activated | The total activated quantity of the product that has not expired. |
| Activated % | The percentage of activation of the product that has not expired. |
| Remaining | The purchased quantity of the product that is not yet activated and not expired. |
| Next Expiry | Date of next expiry, formatted as YYYY-MM-DD. |
| Days until Next Expiry | Days until next expiry of the product. The dashboard is sorted in ascending order of this field. |
| Quantity in Next Expiry | The quantity of the product that expires in the next expiry. |
NOTE
>The dashboard includes only entitlements and line items from Sentinel EMS that are in the Enabled (Completed) state. It does not include entitlements and line items in Draft, Disabled, or Closed states.
>In the case that multiple customers in Sentinel EMS are mapped to a single Salesforce account, then all purchase and activation data for the common products is aggregated.
Activation Trend
This visualized dashboard gives a trend timeline of the peak purchased, peak activated and remaining quantities.

For instance, if you select the Monthly view, the dashboard displays the maximum purchased quantity and activations for each month, as well as the remaining activations. Similarly, in the Daily view, the dashboard will show the quantities on a daily basis.
By default, the timeline is Monthly and starts from the first purchase of the product(s). You can filter the date range for a specific timeline, or product and switch to the daily view. The dashboard shows the data until the current period.
NOTE Entitlements and line items in the Disabled or Closed states appear in the bar chart only for the months or days they are in the Enabled (Completed) state. They are excluded when Disabled or Closed.
Usage Trend
This visualized dashboard gives a trend timeline of how your customers use a selected product over time. This helps you spot usage trends and gain visibility into customer behavior for your products.
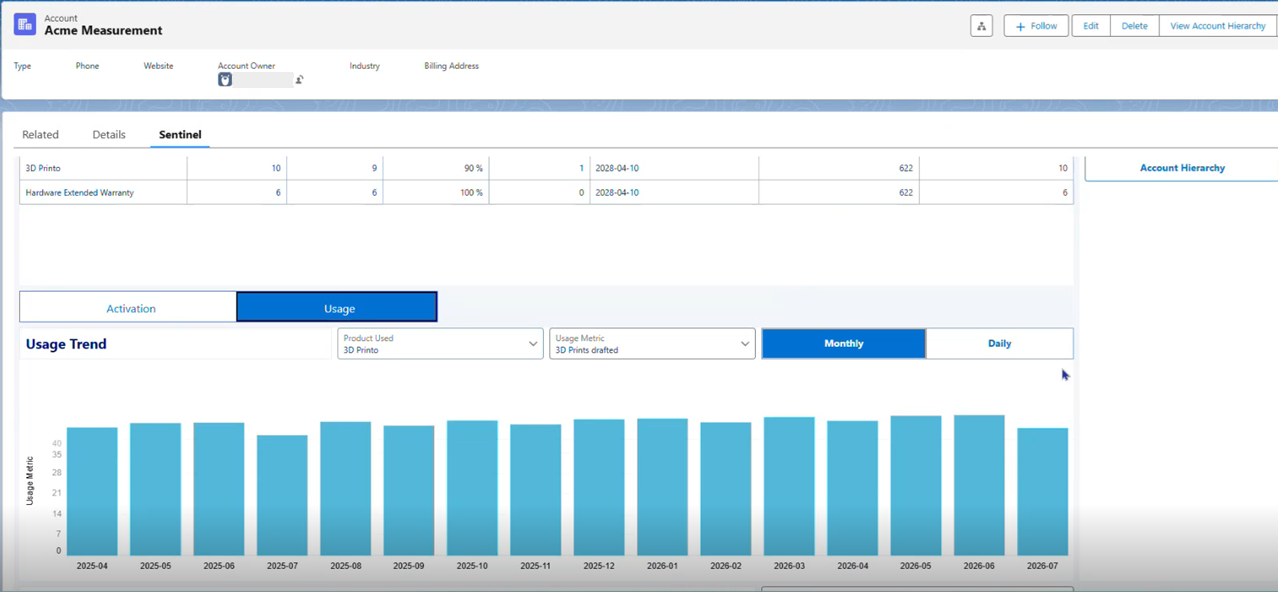
The Usage Trend chart displays the selected product's usage metrics based on the measurement models defined in Sentinel EMS. To set up a new usage metric, contact your Sentinel EMS administrator for adding a new measurement model.
You can shape the view using the following controls:
>Product Used: Select the product to view its usage. For example, 3D Printo.
>Usage Metric: A product can have several usage metrics defined, so you can view the same usage from different perspectives. For example, the product 3D Printo can have usage metrics such as 3D Prints drafted, 3D Prints completed, and 3D Prints failed.
>Monthly or Daily: Switch the time granularity of the chart. For instance, if you select the Monthly view, the chart displays the selected usage metric for each month. If you switch to the Daily view, the chart displays the metric for each day, and you can hover over any bar to see the exact value for that date.
By default, the timeline is Monthly and starts from the first recorded usage for the selected product. The chart shows data up to the current period. You can filter the chart by product and usage metric to focus on a specific product or measure.
Usage Trend Chart Not Loaded
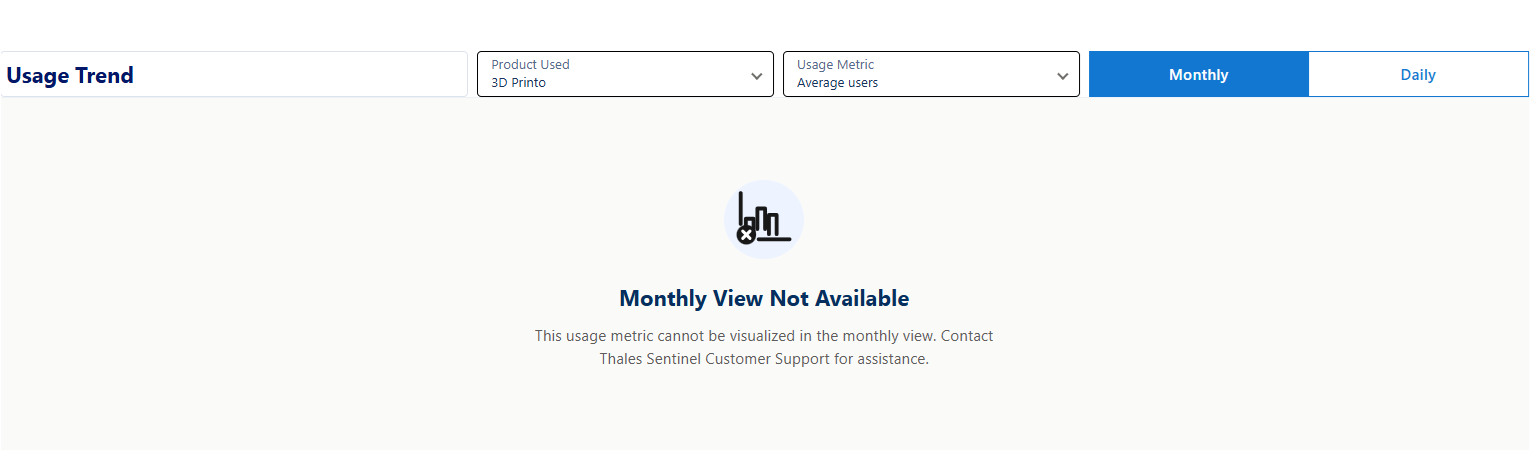
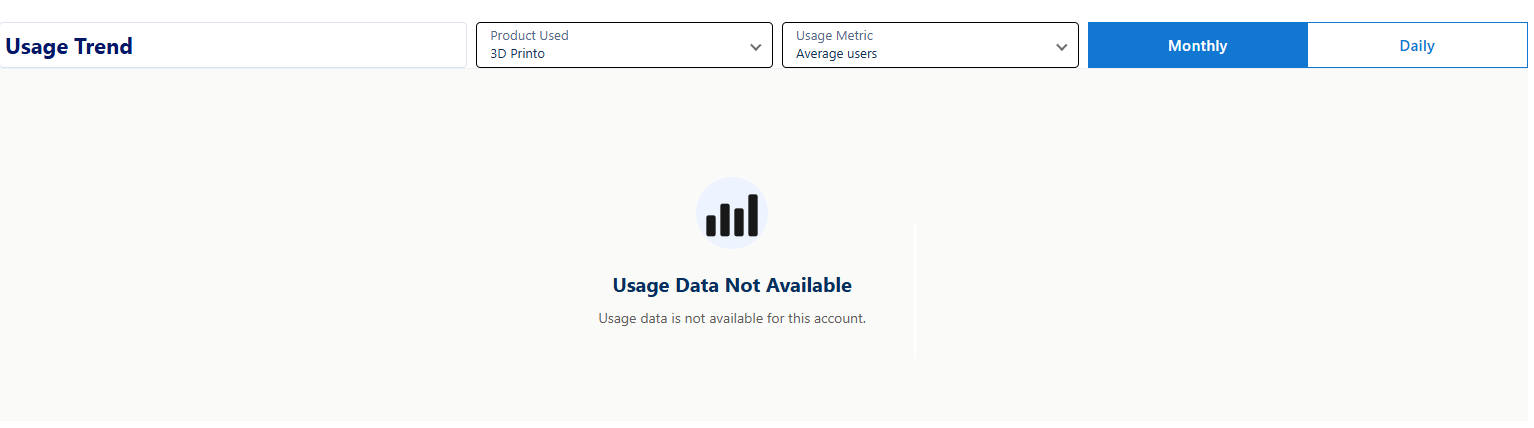
The Usage Trend chart does not display data in the following scenarios:
|
>The Usage-Based Mediation and Metering (UBMM) feature is not subscribed to in Sentinel EMS. >UBMM is subscribed to, but one of the following applies: •The usage sources are not set up in Sentinel EMS. •The usage sources are set up, but no measurement models are created yet. •The usage sources are set up and measurement models are created, but no usage data is flowing yet for any product. |
|
|
Page Filters
You can refresh the view for certain products or other accounts in the hierarchy using the following filters:
Product Name Filter
By default, the dashboards display data of all products of the current account. Use the Product Name filter to refresh the view for specific products.
NOTE The Product Name Filter does not apply to the Usage Trend dashboard. Use the Product Used and Usage Metric filters available under the Usage tab.

See Account Name and Product Name Filters for details.
Account Hierarchy Filter
Salesforce's account hierarchy  feature illustrates the relationship between a parent account and its subsidiaries (child accounts) in a hierarchical structure.
The Account Hierarchy filter allows users to view and select children of the current account to refresh the Entitlement Summary and Activation Trend dashboards. This enables them to see an aggregated result of product purchases and activations from the selected accounts in a hierarchy. All the data points such as the number of purchased quantities, activated quantities and remaining quantities are aggregated accordingly.
NOTE
>The account permissions set up in Salesforce apply and users can only access the account data they are authorized to view.
>Only the child accounts of the given parent account are available for selection.
>The dashboard is refreshed only when the Apply button is clicked after selecting accounts in the Account Hierarchy filter.
 Account Hierarchy Filter Example Scenarios
| Scenario | Filter Applied | |
|---|---|---|
| Only the parent account is selected | The dashboards display data exclusively for the parent account, excluding any information from the child accounts. | 
|
| Only specific child accounts are selected | The dashboards display data only for the selected child accounts, with no information from the parent account included. | 
|
| Both the parent and child accounts are selected | The dashboards display data exclusively for the selected parent and child accounts, excluding any other accounts. | 
|
Dashboards Aggregation Rules for the Account Hierarchy Filter
The aggregation rules which apply to dashboards based on the Account Hierarchy filter are:
| Entitlement Data Fields | Aggregation Rule |
|---|---|
| Purchased |
Aggregated using data from accounts selected in the Account Hierarchy filter. |
| Activated | |
| Activated % | |
| Remaining Fields | |
| Next Expiry | Next expiry date amongst all purchases of the product by accounts selected in the Account Hierarchy filter. |
| Days Until Next Expiry |
The number of days left for the next expiry of the product. The dashboard is sorted in ascending order of this field. |
| Quantity in Next Expiry |
Quantity that expires in the next expiry of the product. |